SALES PERFORMANCE
Know how your sales is really doing.
Revenue, targets, pipeline and team performance in one clear dashboard.
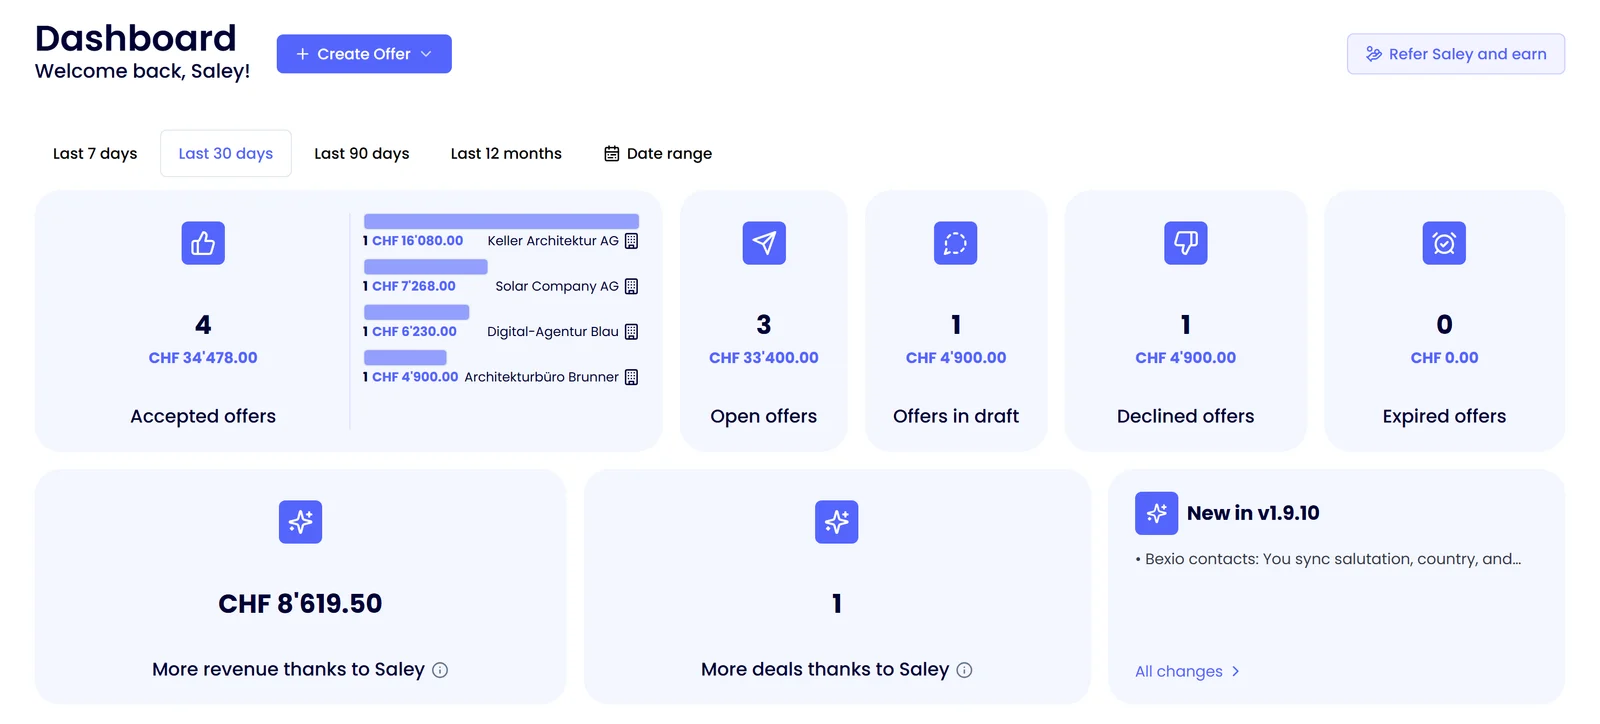

The numbers that really count.
Analyse accepted, open, declined and expired proposals for any period you choose.
View results for the whole company, individual teams or individual salespeople.
Revenue and targets in view.
See how much revenue has already been closed and how your team is doing against the sales targets you’ve set.
CHF 412,800/ Target CHF 480,000
Transparent team performance.
Compare performance within the sales team and see where targets are being hit and where action is needed.
Don’t just look back.
Analyse your current pipeline by stage and see how much potential revenue is in the sales process right now.
With the weighted pipeline, you also get a more realistic forecast based on each deal’s chance of closing.
PipelineCHF 550,500
WeightedCHF 204,075
Trends, not snapshots.
Compare different periods and see how revenue, proposals and pipeline develop over time.